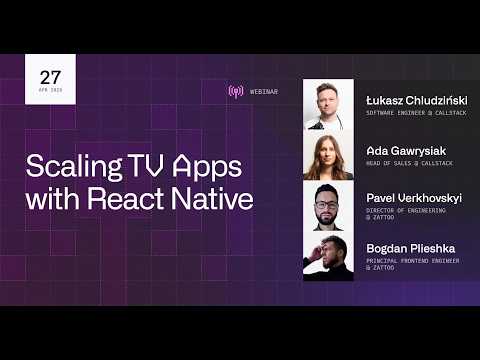
Christoph Pavlak connects performance to business outcomes, arguing that optimization helps companies get more from existing products. He cites examples that Amazon could lose $1.6 billion a year from one second of store lag, and Google could see 20% less traffic from an extra half-second of search loading. The host introduces five metrics: frames per second, time to interactive, app size, memory use, and CPU use.
How to optimize React Native app performance?
Speakers
Callstack developers Adam and Edo, host and software engineer Max Nirenberg, and Head of Business Development Christoph Pavlak discuss React Native performance optimization through a healthcare e-commerce case study and an audit walkthrough.
The client faced falling app store ratings, rising support costs, shorter customer relationships, and difficulty acquiring new users. Many customers used low-end Android devices, where the app loaded slowly and ordering took too long. Adam reports scrolling at 40 FPS and long waits before screens and orders became usable.
The team recommends FlashList where appropriate, targeted memoization, and better networking and state management. They also describe fetching only needed data, running operations without blocking the interface, using lazy tabs, and splitting translations and features into downloadable chunks with Re.Pack. After optimization, scrolling reached 60 FPS, startup fell from 23 to 12 seconds, app size dropped to 10 MB, and the client reported a 4.5 rating and a 22% increase in new-client conversion.
Eduardo describes an audit report organized around analysis, suggestions, and expected results, with a summary of the most important issues. One example identifies hook dependencies causing extra renders; the proposed changes were expected to cut render time by about 40%. Callstack says the audit takes two to four weeks and includes a report presentation and Q&A.
The panel advises weighing new architecture support across an app's dependencies before migrating, and measuring performance both during development and with real users. For large screens, they suggest asking whether all data is needed, then fetching and rendering essential parts first. They recommend repeated profiling, low-end Android devices, and established tools such as Reassure, TanStack Query, and platform profilers.
Takeaways
- Track FPS, time to interactive, startup time, app size, memory, and CPU to make performance problems measurable.
- Profile on low-end devices when they represent a meaningful part of your user base.
- Keep interfaces responsive by moving lengthy operations into the background and showing useful progress.
- Fetch and render only the data and features users need at each step.
- Repeat performance measurements and use them in development workflows to catch regressions.
Mentioned in this talk



Search inside this talk
What was claimed 13
- role atChristoph Pavlak is Head of Business Development at Callstack Team
“our Head of Business Development”
YouTube Unverified1 source· Talk
- metricReact Native: In the case study, scrolling frame rate improved from 40 to 60 frames per second.
“the frame rate came up to 60 frames per second”
YouTube Unverified1 source· Talk
- feature
 FlashList: Recommended for improving React Native list performance; supports a SectionList-style layout.
“we're using FlashList whenever necessary and possible”
YouTube Unverified1 source· Talk
- feature
 Re.Pack: Splits the codebase into separate chunks that can be downloaded when needed to reduce initial app size.
“You can split the codebase into separate chunks and download them when necessary”
YouTube Unverified1 source· Talk
- metricReact Native: In the case study, startup time decreased from 23 seconds to 12 seconds.
“reduced by nearly half, from 23 seconds to 12”
YouTube Unverified1 source· Talk
- metricReact Native: In the case study, app size was reduced to 10 megabytes.
“Ten megabytes is a very nice result.”
YouTube Unverified1 source· Talk
- metricReact Native: After optimization, the client's average rating reached 4.5 and new-client conversion increased by 22 percent.
“the average rating reached 4.5. The conversion rate for new clients increased by 22 percent”
YouTube Unverified1 source· Talk
- launchedCallstack Team launched performance audit
“we've productized this service. As of today, we're launching a landing page”
YouTube Unverified1 source· Talk